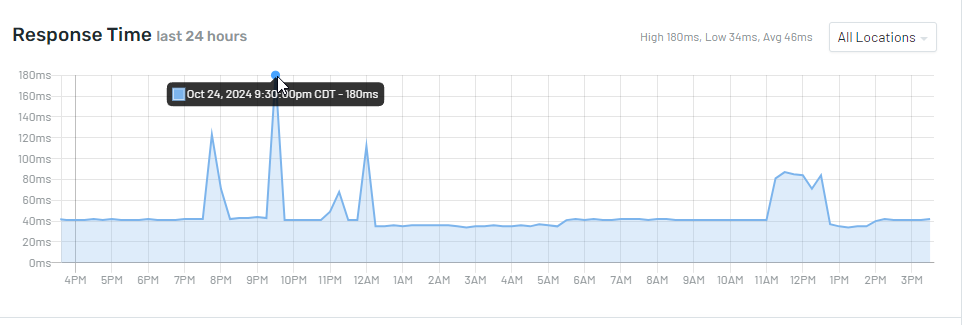
Dynamic Metric Visualization Granularity Support (1, 5, 10, 15 Minute Aggregation)
It would be helpful if the uptime graphs showed response times more accurately than 15 minute intervals. For example, if there is a moment of high latency or irregular response times, it is difficult to determine the exact time of this with the current graphs as it will only show as 9:15, 9:30, etc.
Please authenticate to join the conversation.
Upvoters
Status
Completed
Board
💡 Feature Request
ETA
Jan 08, 2025
Date
Over 1 year ago
Subscribe to post
Get notified by email when there are changes.
Upvoters
Status
Completed
Board
💡 Feature Request
ETA
Jan 08, 2025
Date
Over 1 year ago
Subscribe to post
Get notified by email when there are changes.